RSS

Market Basket Analysis

Market Basket Analysis

Market Basket Analysis

Market Basket Analysis (MBA) is a data mining technique that helps a retailer in several ways. Let us have a first look at the basics of MBA and I’ll reserve the benefits it offers to a retailer for my next post. In a basic fashion, if we want to define MBA, it is the analysis of a shopping basket or a ticket to determine the association or relationship between different SKUs. For instance, there may be an observable purchase pattern that says – whenever a person buys a pack of bread, she may buy a pack of eggs as well. To understand this better, we need to be aware of 2 terminologies namely Support & Confidence. Let us say,

IF (Shopping Basket contains = Bread), THEN Shopping Basket contains Eggs.

The first portion is called the support, ie the frequency with which Bread is bought. The second part is the Confidence, ie the frequency with which Eggs are bought whenever Bread is bought. If we wish to bring some numbers, assume that a store has 100 shopping tickets in a week, containing bread as one of the SKUs purchased. Out of these 100 tickets, 75 tickets have eggs as well. This means that there is a close association between Eggs and bread. (75% of whenever bread is purchased, eggs are purchased too).

One oft-quoted example is the case of Walmart, who determined that there is a close association between the purchase of baby diapers and beer cans. One can find the reason behind this in quite a few websites. But the point is that, many a times, the associations may be out of the reach of a retailer’s imagination. Thus, using a proper IT system to determine such associations is very essential. Now let us see a preliminary method to determine such associations.

First and foremost, the retailer should capture all the transactional data from the POS. In every shopping ticket, we can compare all the SKUs with all the other SKUs. If we do this exercise for all the shopping tickets over a period of time(say 12 months), we can identify different combinations of SKUs which occur more frequently in many shopping tickets. (We can perform a similar analysis for every customer, instead of every shopping ticket, if we want to solicit suitable offers for customers). We can sort the different combinations of SKUs in the descending order of their frequency. Now for each high frequency combination, we have to find out the number of tickets (or customers) that bought only one of these 2 items. Then we can determine, if there is a strong potential to sell the other SKU as well to those customers who bought only one of those SKUs. The result of our preliminary analysis will look something like:

This states that Bread & Eggs were bought 550 times together, but Bread was bought for a total of 700 times. Ie., There is a scope for selling Eggs 150 more times, than the normal sales.

This is a very elementary analysis, just to explain the basics. In real world, MBA can be far more complex. The reasons for complexity are as follows:

  • The association need not be always 1 to 1. It can be 2 to 1 or 3 to 1. For instance, in our eggs & bread example, the purchase pattern can be something like:

IF (Shopping Basket contains – Bread & Cheese), THEN Shopping Basket contains Eggs. (Bread & Cheese, instead of Bread alone)

  • The association can be dependent on the demographics of the consumer – For example, the association between Pepsi & Chips is strongly felt only when the purchaser is a male. Another example could be – The association between Noodles & Ketchup is strongly felt only in stores located in down-town and not in sub-urban region.
  • The association can be dependent on the day of the week or season of the year. For example, there can be a strong association between Pepsi & Chips only on a Friday evening. There can be a strong association between paper plates and donuts only on the first 3 weeks of a spring season.

I hope this gives some basic idea about Market Basket Analysis. Let us delve into the benefits that this can offer to a retailer in the next post.

 
4 Comments

Posted by on October 30, 2011 in Market Basket Analysis


Tags: , , , , , , ,

Markdown Optimization

Markdown Optimization

Markdown Optimization

Markdown Optimization is one of the enticing phenomena for many retailers and also one of the buzzwords that are of interest to many retail analytics firms. Before talking about markdown optimization, let us try and understand what is markdown and what is the need to optimize it? Markdown, as most of us are aware is marking the selling price of an SKU below the normal selling price, in an effort to increase the sales of that particular SKU. More often than not, such an act is performed to clear the inventory from the stores. Though retailers claim to have many sophisticated techniques to forecast the demand and policies that govern the inventory replenishment, quite often they see some SKUs piling up in stores and feel the heat to reduce the price so as to get rid of them as early as possible.

Let us use some numbers to get a better frame. Assume that a pack of dozen donuts cost $3 for a retailer. The retailer sells it for $5 under normal circumstances, which will give him a profit margin of $2. Assume that the donuts expire in 3 days after the stock arrives in store. If the donut doesn’t sell by the date of expiry, the retailer has to just dump down the remaining stock and in this case, the loss would be $3. In the best scenario, the retailer gains $2 and in worst scenario, the retailer loses $3 for every pack of donuts. Hence as the date of expiry approaches, the retailer would take any measure to reduce his loss. Eventually he’ll end up marking down the price of donut. Let us assume the price is brought down to $4 on the day before the expiry date and to $2.5 on the day of expiry. If the retailer stocks 100 pack of donuts, he would expect to get a total revenue of $500. What if the actual sales don’t go the way he expects? We’ve taken 3 different cases depicting 3 possible sales figures on 3 days.  Selling price on Day 1 is $5, $4 on Day 2 and $2.5 at Day 3. All the remaining donuts will result in a loss of $3 for the retailer.

Let us take the last row – the retailer invests $300 (for 100 packs) and gets only $295. (355 – 60). If the retailer has 100 such stores, he will encounter a loss of $500, whereas he would have expected a profit of $20000. ($2 * 100 * 100). Instead, if he had kept the selling price at $4 on Day 1, and if that makes the retailer sell all 100 on the same day, he would have got a profit at $10000 ($1 * 100 * 100). (In addition to these loses, for most products, whenever there is a price change, that will involve generation of new price labels, updating the IT systems, moving the SKUs from one place to another etc., All this will cost to the retailer’s operations.)

Thus, the decision of how much to markdown and at what time is of utmost importance for a retailer. You may be wondering as to how the retailer will know that if he reduces the price to $4, he will get rid of all the donuts on the first day itself. This is where the concept of price elasticity comes into picture. This is where the factor of seasonality comes in. This is where the purchase behaviour of the consumer comes in. The increase in demand of a particular SKU for a unit change in price is called Price Elasticity. For instance, a retailer may think that if the price of a pack of donut is reduced by $1, that will increase the sales by 50 units. Donut sales may not be uniform in all seasons. It may be on the high during winter or spring. The consumer may prefer to purchase donuts may be on a Saturday morning or a Sunday morning but may not buy on a Monday morning. How does a retailer can know all these? Scientifically, that can be obtained by previous sales data. How the sales of a particular SKU varied with respect to day of the week, season of the year, variation in price etc., And for SKUs like leather shoes or a TV or a refrigerator, the sales may get influenced by general economic conditions.

The success of a retailer’s price optimization or markdown optimization depends largely on understanding the above mentioned factors. Ie.

a)      Price elasticity of an SKU

b)      Purchase behaviour of consumer with respect to that SKU

c)       Exact implication of seasonality on that SKU

d)      Macroeconomic conditions that prevail

If a retailer is able to figure out these, then most of the work in devising a markdown strategy can be considered complete. Unfortunately, many retailers fall into the trap of intuitively guessing the sales and end up generating mark down prices, which are not optimal.

Another set of retailers blindly go behind sophisticated products in the industry. There are quite a few retail analytics suite of products available in the market. All of them provide provisions to set up rules, do What-If Analysis, generate insightful charts etc., But the power of such tools can be extracted only if they are configured with the right data and right set of rules and assumptions. Hence it is imperative for the retailers to understand the factors influencing the sales and only that will help them in finding out what to markdown, when to markdown and how much to markdown.

 
Leave a comment

Posted by on October 25, 2011 in Markdown Optimization


Tags: , , , , , ,

Product Information Management

Product Information Management

Product Information Management

Product Information Management (PIM) can be referred to as the process of managing information about all the products that a retailer sells, in a controlled and centralized fashion in order to maintain consistency in terms of the information sent out through different channels. For instance, a product is stocked in a store shelf with a price tag. The same SKU should not be advertised in a print ad with a different price tag. To be little more elaborate, the information about an SKU should be consistent irrespective of the communication channel – be it a website of the retailer, be it a print ad, be it a store shelf, be it the details passed to suppliers. When we say information, it can be price or any other attribute about the product. Such a Product Information Management system is extremely important especially when the retailer has different store formats and several communication channels.

Typically, price of an SKU would be maintained by the pricing department of a retailer and they may have a certain IT system to do that. Content of the website, describing the attributes of the same SKU would be maintained by Content Management team of the retailer and they may use a different IT system. The department that governs the print ad, TV Commercials, brochures and coupons may be using an even more comprehensive system (with digital images about the products etc) to perform their functions. There may be yet another team that works on generating content or coupons for mobile phones. There may be few other departments of a retailer who deal with different attributes of an SKU. It is mandatory that all these departments work on an integrated IT system, so that the information furnished through different communication channels remain consistent. This explains the need for a Product Information Management System.

There are quite a few popular PIM products available in the market – some by big players like IBM and Oracle and some more by smaller players like STIBO systems and Heiler. These tools are most likely to be customized for a retailer’s requirement and then implemented. Such PIM tools offer various functionalities such as classifying the products, managing their structure and their relationships between each other, managing the product attributes, linking the products to several digital images, controlled access to product information, importing and exporting products and their attributes to and from such products, reporting features etc., Such a tool, once implemented should be seamlessly integrated with various other IT systems of the retailer so as to maintain the integrity of the product information.

I hope this helps to understand what PIM means and gives a preliminary overview about the need for a PIM product.

 
Leave a comment

Posted by on October 22, 2011 in Product Information Management


Tags: , , , , ,

Measuring Out of Stock

Measuring Out of Stock

Out of Stock Analysis

If there is a single term that any store manager would hate to hear, that would be “Out of Stock”. Incidentally, this very same term is the one that irritates a consumer most. “Out of Stock” or “Out of Shelf” as it may be called is a common phenomenon per se, but what is also quite common is the inability of even leading retailers to precisely quantify the loss because of OOS situation. Retailers’ nightmare is that even after the goods are replenished to the store as per the records, the products are not at times available in the shelves. As one can quickly imagine, this is because the stock may be piled up or hiding somewhere in the backroom of the store, which makes it quite difficult for the store personnel to locate and place it in the right shelf. Even trivial, one or two SKUs might have fallen back in the shelf, thus hiding it from the vision of the consumer.

If one is puzzled as to whether this phenomenon is really so significant that it needs special attention, the answer is a big YES. There are many statistics that support the significance of studying OOS. Losses to the retailer because of OOS can be many – from a temporary loss of sales to permanently losing a valuable customer. But we would just be talking in the air unless we know of a method to quantify the losses because of OOS or at least to measure the OOS.

Let us try and see if we can quantify the OOS situation in some very preliminary ways.

a)      One of the techniques is applicable for certain fast moving goods – for instance Bread, Fresh Vegetables like Spinach, Fruits, and in some countries groceries like rice and pulses. Assume that a particular variety of bread is sold on an average of 70 packets per week (say 7 days). If a particular variety of bread is not in shelves for say 1 day, then the loss of sale is 10 packets. I know it’s quite elementary, but the truth of the matter is not many retailers do even this basic calculation.

b)      Second technique is a slightly different variant of the first one. Instead of quantifying in units, some SKUs may warrant to be converted into Monetized value. For instance, on a normal day (8 hours) California apples are sold for $200 and on a given day, for 2 hours, apples were not in shelves. Then the loss is $50.

c)       There may be some goods which are slow moving and the quantification of OOS for such SKUs can be done little differently. For instance, assume a particular brand of healthdrink is normally present in a retail store. For a few days if it is not present, then we can very well measure the OOS in terms of number of days, the particular SKU is not available. Of course, the ultimate aim is to reduce the number of days it was out of stock.

These 3 measures can easily be captured from a retailers’ IT system, even if they don’t have highly sophisticated Retail Management software. But there are even more complicated methods to measure OOS. I’ll state a couple of examples before I close this topic.

a)      Number of times an OOS has been reported – This is applicable for some unique products that not many consumers will look for. For instance, a particular model of a premium sunglass with a unique frame and a unique tint of glass may not be available always in a store. But data can be captured whenever a customer asks for such special products to capture and measure the lost sales. Even though it may not be a fast moving good, the high margin of such an SKU and service level of a key customer may prompt a retailer to capture this vital information.

b)      Another technique that will be applicable for fast moving goods is the availability rate of an SKU. Ie. What is the probability that a particular SKU will be available in the store shelf, when a customer walks in at anytime? Special audits can be conducted or mystery shoppers can be employed or even the store personnel can do a periodic check to know the availability, and the data can be captured electronically.

The techniques listed above are just a few representative ones and depending on the retailers’ needs and the nature of the business, innovative methods can be devised to quantify Out of Stock Situation in a retail store. I hope this gives some basic understanding about Out of Stock and the means to measure such situations.

 
Leave a comment

Posted by on October 11, 2011 in Out Of Stock Analysis


Tags: , , , , , , , , ,

Social Commerce

Social Commerce

Social Commerce – An overview

Social Commerce can be defined as an emerging trend in ecommerce that encompasses the usage of social media, which helps or tries to influence online buying and/or selling of goods and/or services. For the past 5 years, this terminology is gathering momentum and in recent future, it is sure to make tidal changes in the way businesses are influenced, just like TV advertisements created a revolutionising impact on the purchase behaviour when they were first aired. In a very basic sense, it is all about adding a component called “word of mouth” into the world of e-commerce, as IBM rightly phrased it.

Social commerce is not just about creating a means to purchase online through a social networking website, but also comprises of mechanisms by which, a buyer recommends a product (like the one we see in Amazon), a website, where we can create a wishlist of our favourite songs or books and share it with our friends etc.,

Nowadays, we can see a few million business firms setting up their pages in facebook all around the world. Arguably, Facebook has emerged as the most popular social networking website and many are using the term Facebook commerce (F-Commerce) and Social Commerce interchangeably. Not to forget, YouTube, LinkedIn and twitter all play a significant role in the arena of social commerce.

Gone are the days, when people expected the description of the product and price in the retailers’ websites. They are now more informed than ever before and they want to take informed decisions. They are looking for websites that give user reviews, ratings, recommendations by previous users, so on and so forth. These components are also called “Social Plug-ins”. We are also seeing the emergence of social reward programs in the form of social media powered loyalty programs. There are companies like Lockerz.com & Mylikes.com that run based on this business model. Lockerz for example is a social commerce platform, where members are rewarded with points (Called PTZ) for introducing their friends to their favourite fashion, electronics and technology brands, as well as music, videos and more. Lockerz Members earn PTZ by answering daily questions, watching videos, listening to music, inviting their friends to buy their favourite brands, purchase digital assets etc., PTZ are then used to lower the prices of merchandise in the Lockerz Boutiques.

Companies are trying innovative ways to keep the customers more engaged and interactive in the whole process of shopping online. The key lies in bringing the potential buyer to the company’s website through some means and making him or her get attracted towards the way the information about the product or service is presented. It should be in such a way that the person gets all the information he requires before buying that product. Already, Social Commerce has made significant inroads into the world of ecommerce, but we all hope that the best is yet to come.

 
Leave a comment

Posted by on October 5, 2011 in Social Commerce


Tags: , , , ,

Pop-up Retailing

Pop-up Retailing

Pop-up Retailing

Introduction

Pop-up Store” also known as Pop-up retail outlet is a trend in retailing, wherein a retailer opens a small, temporary shop to promote its products. The name comes because of the fact that these shops pop up one day and then disappear after a few days. The main intention of such stores is to promote awareness about the new products introduced by retailers. Retailers use such stores as a medium to get their products to the neighbourhood of consumers, rather than making consumers travel to traditional malls and other retail outlets. These outlets are designed in order to make the customers drop by casually and interact freely to know about the products.

How is it done?

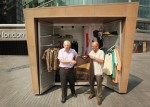
Nowadays retailers across the world use this format differently for different reasons. An empty store space in a mall is rented for a short duration and then used as a pop-up store. An apparel retailer may use it for selling (say for example) special edition T-Shirts, caps and other accessories and these stores will be gone after a few days. Even a school bus is used as a pop-up store; inside the bus, instead of seats, one can find shelves with shoes, t-shirts, caps etc.

Retailers use it to create buzz and excitement about the new products that are launched. At times, when a new brand of store is launched or a retailer is opening its operations in a foreign country, they open pop-up stores in several locations at the same time, and that gives the retailers, needed brand popularity and publicity. Arguably, such an act is less costly than creating and telecasting ads in TVs. Interestingly, in some places, certain grocery retailers are sending mobile vans in a bid to reach consumers at their door steps to sell vegetables and other fresh food products.

By bringing in an element of surprise and limiting the availability of products, pop-up retail has become an extremely successful format to create curiosity in the minds of consumers, thus promoting the retailer’s brand. This trend has been changing the way business is conducted and customers are attracted to a store.

Examples from around the globe

US discount store Target, widely known as the king of pop-up retail, opened a temporary 1,500-sq. ft. store in Rockefeller Center for five weeks in October 2003 to showcase Isaac Mizrahi’s new women’s wear line of clothing1.

Adidas recently opened 6 pop-up fan-stores in secret locations in Germany, Austria and Switzerland to give get-it-first fan access to its ‘Ransom’ and ‘Blue’ collections2. For the launch of Stella McCartney designed Team GB 2012 Olympic gear, Adidas took over a store for 4 weeks in London’s Westfield mall.

“Self Magazine” opened The Self Center, a Spa in New York City for a month. With a $25 entry fee, customers had full access to all services including free makeovers and consultations with physicians for Botox and other beauty treatments3.

In India, ITC has launched mobile ‘pop-up’ stores, in order to reach consumers right at their doorsteps. It has launched about 50 such pop-ups in Hyderabad – vans which will visit neighbourhoods – to sell vegetables and other food products for half-a-day on an appointed day. The company representatives have drawn up a timetable after discussing the timings with residents’ associations4.

Sources

1 http://trendwatching.com

2 http://socialcommercetoday.com

3 http://www.chillibreeze.com

4 http://news.franchiseindia.com

 
1 Comment

Posted by on October 1, 2011 in Pop Up Retailing


Tags: , , ,

Mobile POS (Point of Sale)

Mobile POS (Point of Sale)

Mobile POS

The first POS was designed in the year 1870 and was used in Dayton’s OH Saloon. Over the years more enhancements were made to the cash registers. In 1970, the first computer driven cash registers were introduced. In late 1980s, retail software based on PC technology started making its way. In the 1990s, with the advent of wireless network, the face of POS encountered significant changes. Nowadays, POS equipments are designed as modern mobile devices or portable computers for completing transactions.

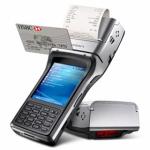
Mobile POS is a portable solution to process sales transactions and returns. They also have provisions to make card payments. Whenever, the cash counter has a long queue, the number of cash registers can be increased without increasing the number of stationed POS machines. A portable POS device as the one shown here can be given to the store personnel and customers can approach them to complete their purchase.

Store associates can scan all the items in the customer’s shopping cart with the help of the UPC (Universal Product Code) scanner attached along with the mobile POS. Once the scanning is over, the payment for that sales transaction can be made by the customer with the help of a credit/debit card by swiping it in the same machine along the slot provided for the same. The mobile POS will be connected to the store server and the card details will be communicated through a secured wireless network to the store server. The store server in turn communicates to the 3rd party agencies like Visa and Master Card, for authorizing the payment. Once the payment is authorized, the information is sent back to the store server, which in turn will communicate to the mobile POS. The receipt for the transaction can be generated in the same device.

There are certain key benefits in using such a mobile device instead of a conventional POS machine. They are as follows:

  • The wait time for the customers during the checkout can be reduced as they don’t need to stand in a long line.
  • They can interact with the store persons on the shop floor and make decisions about their shopping choices and complete the purchase.
  • Whenever the retailer wants to increase the number of POS machines in their store, they don’t need to add a new cash register compromising the existing floor space. Instead a new device can be procured and can be kept wherever needed.
  • During adhoc peak sales hours, these devices will be very helpful in handling additional sales volume.
  • Such devices also have the provision to feed in the customer information via the keypad and receipts can be electronically sent to the customer’s mail id.
  • These devices are designed in such a way that they can be integrated with the legacy POS systems. This would mean that there is no disruption to the data or processing of the retailer.

While deploying such a system in place, there are a few things to concentrate. For instance, the connection to payment gateways should not be disrupted during the processing of a transaction. Hence the wireless connectivity should be as effective as any broadband connection. There will be specific security guidelines (SOX, PCI Compliance) in different countries with regards to mobile payment and those are to be adhered to. If these things are taken care, mobile POS will be a great gift for retailers across the world, given the features that they bring along.

References

www.mobilewaytopay.com

www.ibsinternet.com

www.retailanywhere.com

www.retailsystems.com

 
Leave a comment

Posted by on September 28, 2011 in Mobile POS


Tags: , , , ,